CDL’S JOURNEY TO NET ZERO
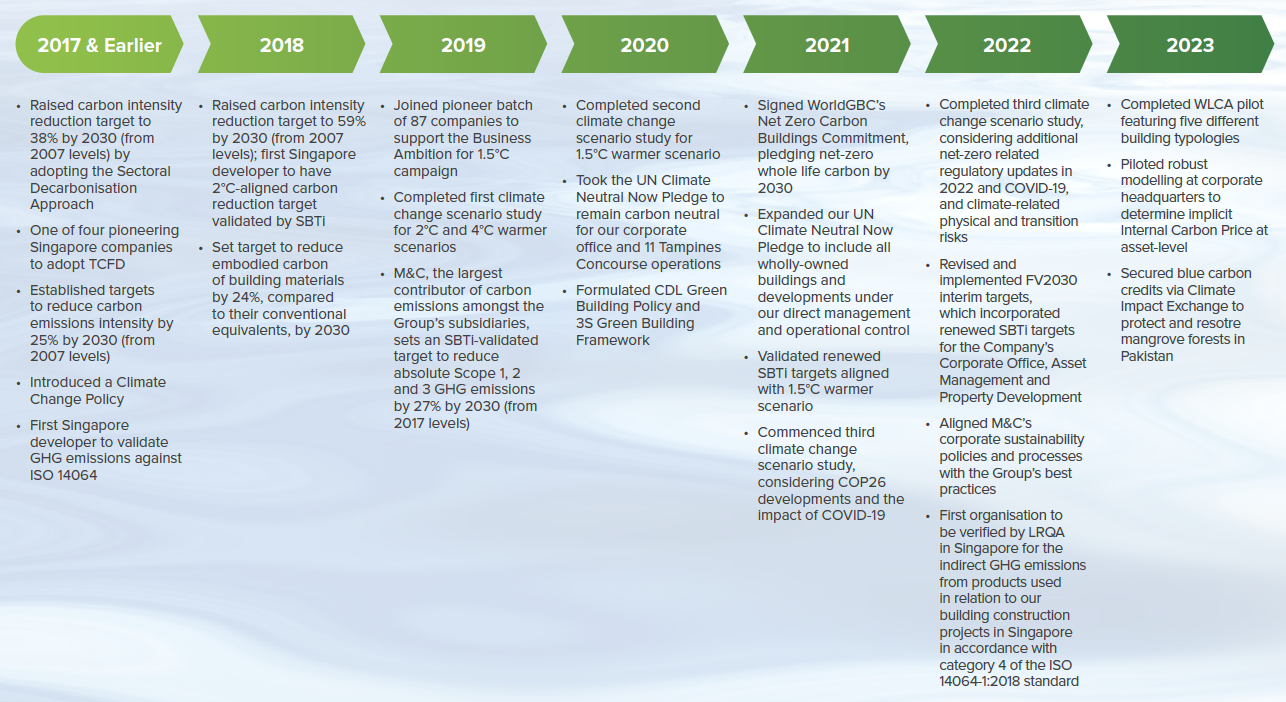
CARBON REDUCTION STRATEGY AND PERFORMANCE
To address the climate crisis, reduction in carbon emissions is crucial. The Company has been measuring, tracking and reducing our impact on the environment with robust environmental impact data transparency through CDP disclosures since 2010. In 2023, the Company remained on the CDP A List for the 6th consecutive year for climate change, and the 5th year for water security.
Since 2018, the Company has been the only company in Southeast Asia and Hong Kong to remain on the CDP A List. We are the only Singapore company to achieve double ‘A’s for climate change and water security on the 2023 CDP A List. This reaffirms our climate-focused strategies in strengthening our resource-efficient portfolio towards a climate-resilient future.
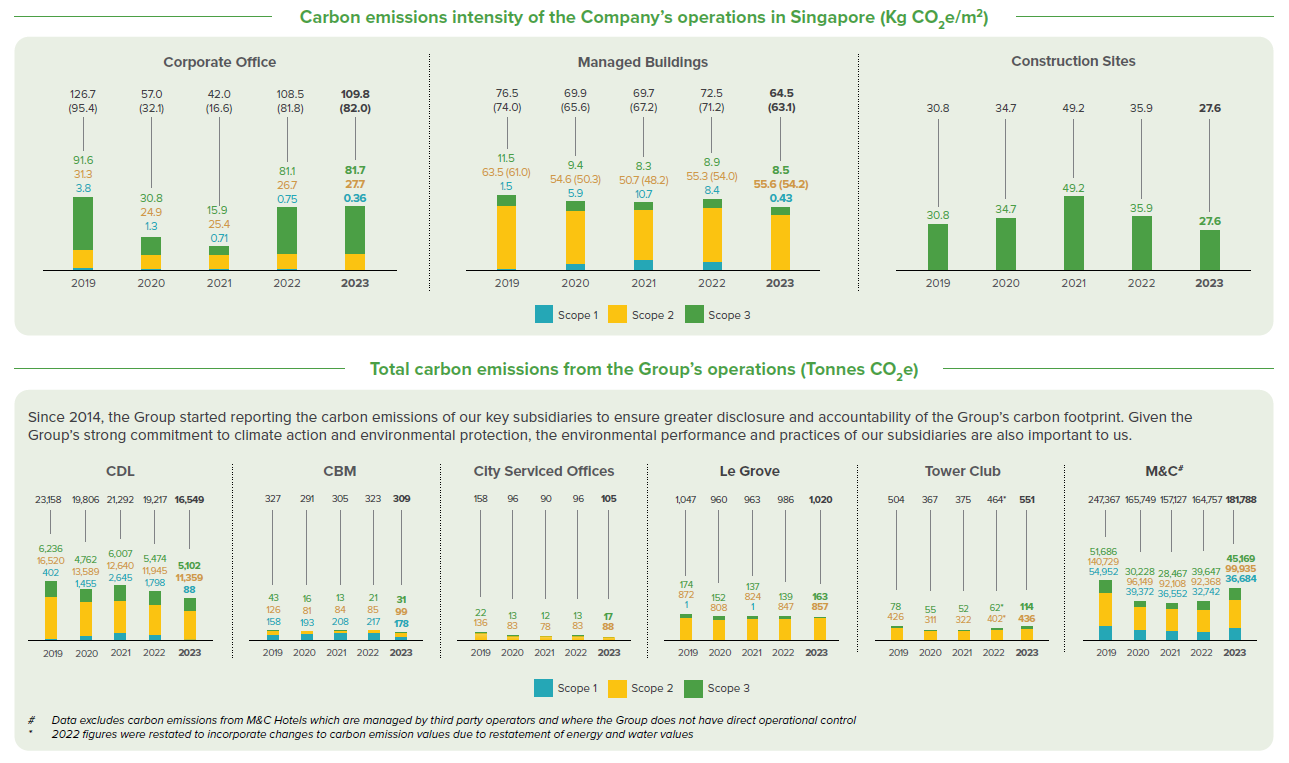
Operational Carbon Emissions Performance
The Company’s largest source of emissions is electricity usage, reported under Scope 2 emissions. Therefore, the key focus of our carbon mitigation strategy is to reduce Scope 2 emissions. Details can be found in pages 93 to 95 of CDL’s ISR 2024.
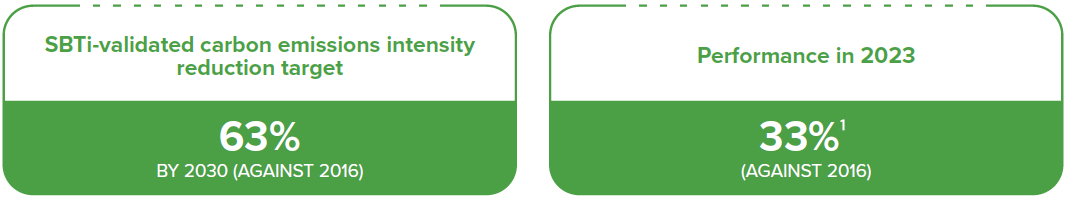
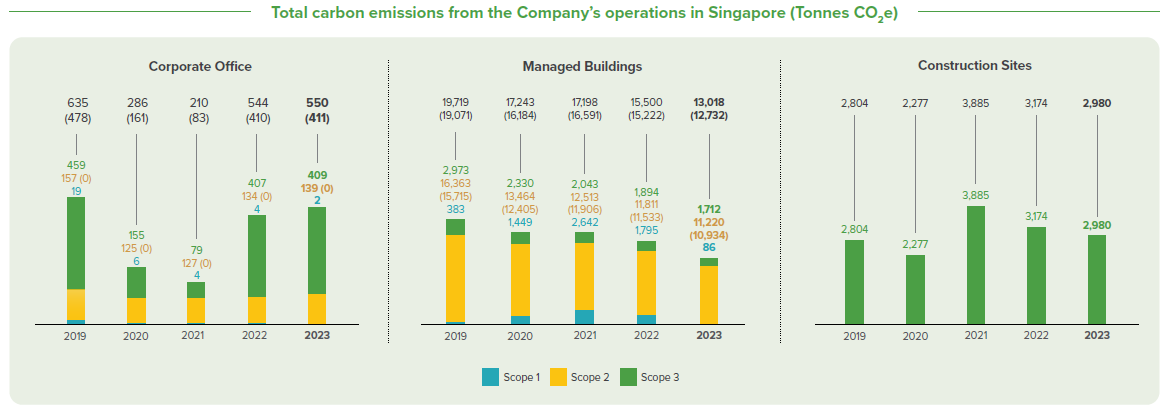
In 2023, the Company achieved a carbon emissions intensity reduction of 33%1, as compared to the baseline year of 2016.2 Total operational carbon emissions decreased by 14% across the Company’s business operations in Singapore compared to 2022.
The Group recognises the importance of addressing Scope 3 emissions, which are indicators of exposure to climate risks in our supply chain or use of products. We monitor and report Scope 3 emissions to enhance our carbon reduction efforts by identifying large emission sources along our value chain.
In 2023, as business operations steadily return to normalcy, a rise in Scope 3 emissions was recorded as business travel and employee commute picked up through the year.
In line with the six GHG inventory categories as described by ISO 14064-1:2018, Scope 1 emissions as per GHG protocol will correspond to Category 1, Scope 2 will correspond to Category 2 and Scope 3 will correspond to Category 3 to 6 of ISO 14064-1:2018.
Carbon Emissions Reduction Initiatives at Group Level
As part of our efforts to integrate sustainability into our value chain, the Group has stepped up global alignment with M&C, our largest subsidiary by GHG emissions contribution. As part of the Group’s renewed SBTi-validated targets aligned with a 1.5°C warmer scenario, a new emissions reduction target of 58.8% under Scope 3 (Category 15: Investments) was introduced; impacting six key subsidiaries, including M&C.
As our key subsidiary and major contributor of total Group Scope 3 emissions,3 we worked closely with M&C in 2023 to identify further opportunities to reduce absolute emissions.4 M&C also established a target for all Singapore-based hotels to be Global Sustainable Tourism Council (GSTC)5-certified by 2025. With local M&C hotels certified as sustainable accommodation under GSTC, we will be compliant with the highest social and environmental standards in the market.
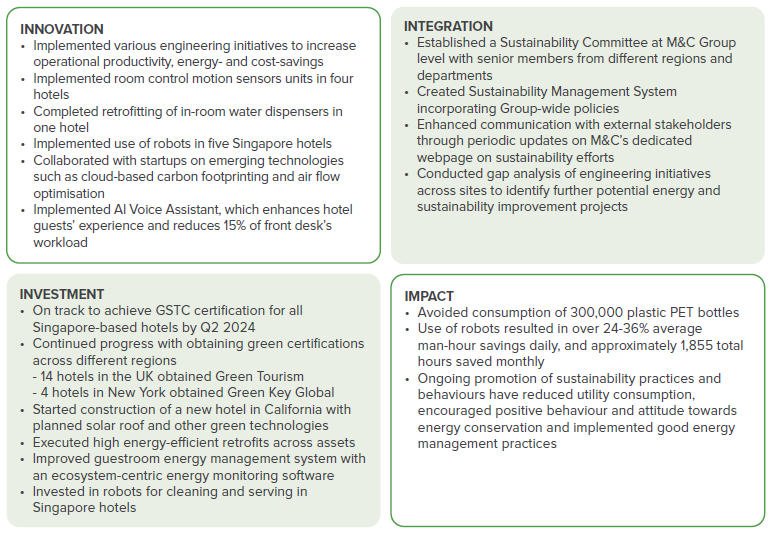
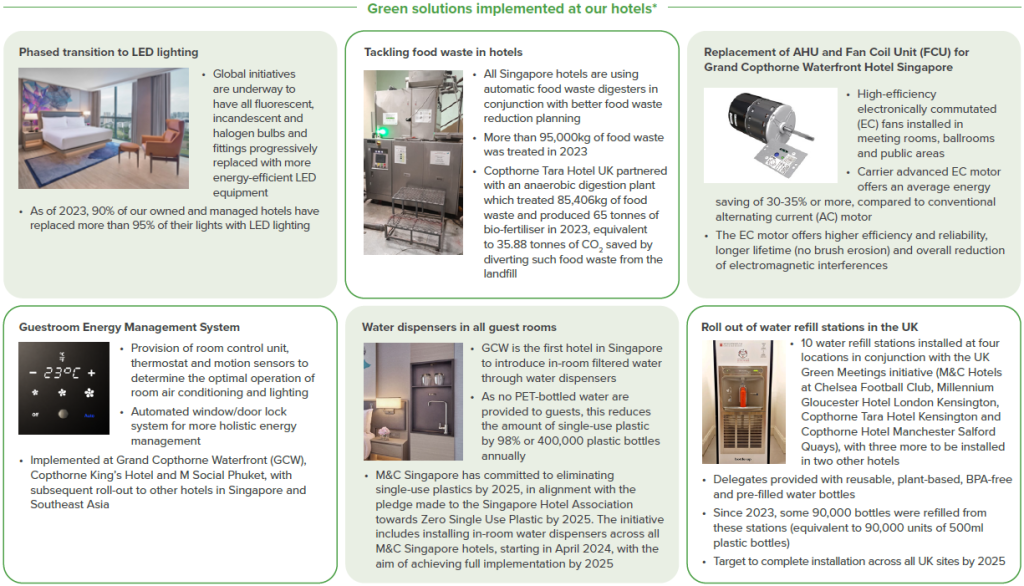
M&C implemented multi-pronged initiatives to enhance its sustainability commitment throughout 2023:
| Notes: | |
| 1 | There has been a change in emission factor applied between 2016 and 2023. The reduction value would be 25% when calculated on a comparable basis |
| 2 | The Group’s renewed SBTi targets were validated in December 2021. After revising interim targets with endorsement from management, stringent carbon emissions intensity reduction rates based on the new 2016 baseline year were operationalised since 2H 2022 |
| 3 | Based on publicly disclosure data from 2016-2020 |
| 4 | In 2019, M&C established its SBTi-validated target to reduce the Group’s carbon emission by 27% by 2030. The 2°C aligned target aims at absolute emissions reduction of 27% for owned and managed hotels under Scope 1, 2 and 3, from a 2017 base year |
| 5 | GSTC criteria serve as the global standards for sustainability in travel and tourism. The criteria are used for education and awareness-raising, policy-making for businesses and government agencies and other organisation types, measurement and evaluation, and as a basis for certification. It covers sustainable management, socioeconomic impacts, cultural impacts and environmental impacts |
| Notes (applicable throughout this Natural Capital Section): | |
| • | In ISR 2023, plans to install roof-mounted photovoltaic panels for Knightsbridge UK were initially reported but subsequently did not proceed due to site constraints and lower renewable energy output |
| Notes: | |
| • | Scope 1 includes direct emissions from fuel used in power generators, petrol for company vehicles, loss of refrigerant in air conditioning systems, loss of insulating and arc quenching media in switchgear systems and discharge of fire suppression agents. |
| • | Scope 2 includes indirect emissions from purchased electricity consumed by the operational activities of the Company at both our corporate office and managed buildings. |
| • | Scope 3 includes emissions arising from property development operational activities (e.g. fuel used in power generators and heavy vehicles, purchased electricity, electricity upstream emissions and transmission losses, and water usage), and other indirect emissions (e.g. electricity upstream emissions, distribution and transmission losses, local and international courier services, employee commute, business air travel (excluding the influence of radiative forcing) and hotel accommodations, water supply and wastewater treatment at corporate office and managed buildings). |
| Notes (applicable throughout this chapter): | |
| • | The operations namely Corporate Office, Managed Buildings and Construction Sites refer to the Company’s Singapore operations. They exclude hotel properties. |
| • | Figures stated in charts may not add up due to rounding of decimals. |
| • | In accordance with GHG Protocol, Scope 2 emissions are calculated using both location-based and market-based methods. The figures shown in brackets represent calculations using a market-based method and include the reduction in emissions from the purchase of RECs. • Corporate Office: The Company’s Corporate Office in Singapore occupied approximately 5,013m2 across four floors in Republic Plaza. The measurement applies to all environmental performance reported in this chapter. • Managed Buildings: In 2023, the Company managed seven office buildings, two retail buildings and two industrial buildings in Singapore, with an average monthly net lettable area of 131,924m2, 45,456m2 and 24,394m2 respectively. The measurement applies to GHG calculations, with all other environmental performances reported using the net lettable area. • Construction Sites: In 2023, the Company measured and monitored the environmental impact and performance of 10 active construction sites in Singapore with a GFA of 108,151 m2 built for that year. The measurement applies to all environmental performance reported in this chapter. |